
/s/<supervisor>/clusters/<cluster>) is built entirely from read-only calls through the tenant’s own kubeconfig, which Celum already holds on the supervisor. All of these live under /api/clusters/<cluster>/... and take ?supervisor= and ?namespace= query parameters to disambiguate which supervisor hosts the cluster and which namespace its Cluster API objects live in.
<supervisor> and <cluster> are placeholders throughout, and payload excerpts are trimmed — real responses carry more rows and fields.Nodes and events
GET /api/clusters/<cluster>/nodes lists the cluster’s machines — the Cluster API view of its nodes, with phases and versions. It pairs with the events feed, GET /api/clusters/<cluster>/events, which is the first stop for “why is something failing in this tenant”:
kubectl get events would show.
Metrics — and the available: false case
GET /api/clusters/<cluster>/metrics aggregates CPU, memory, storage, pod counts, per-node stats, and top namespaces. When the tenant has no metrics source installed (no metrics-server or monitoring agent), the endpoint does not error — it returns this, and it is the expected response, not a failure:
available: true.
Helm releases
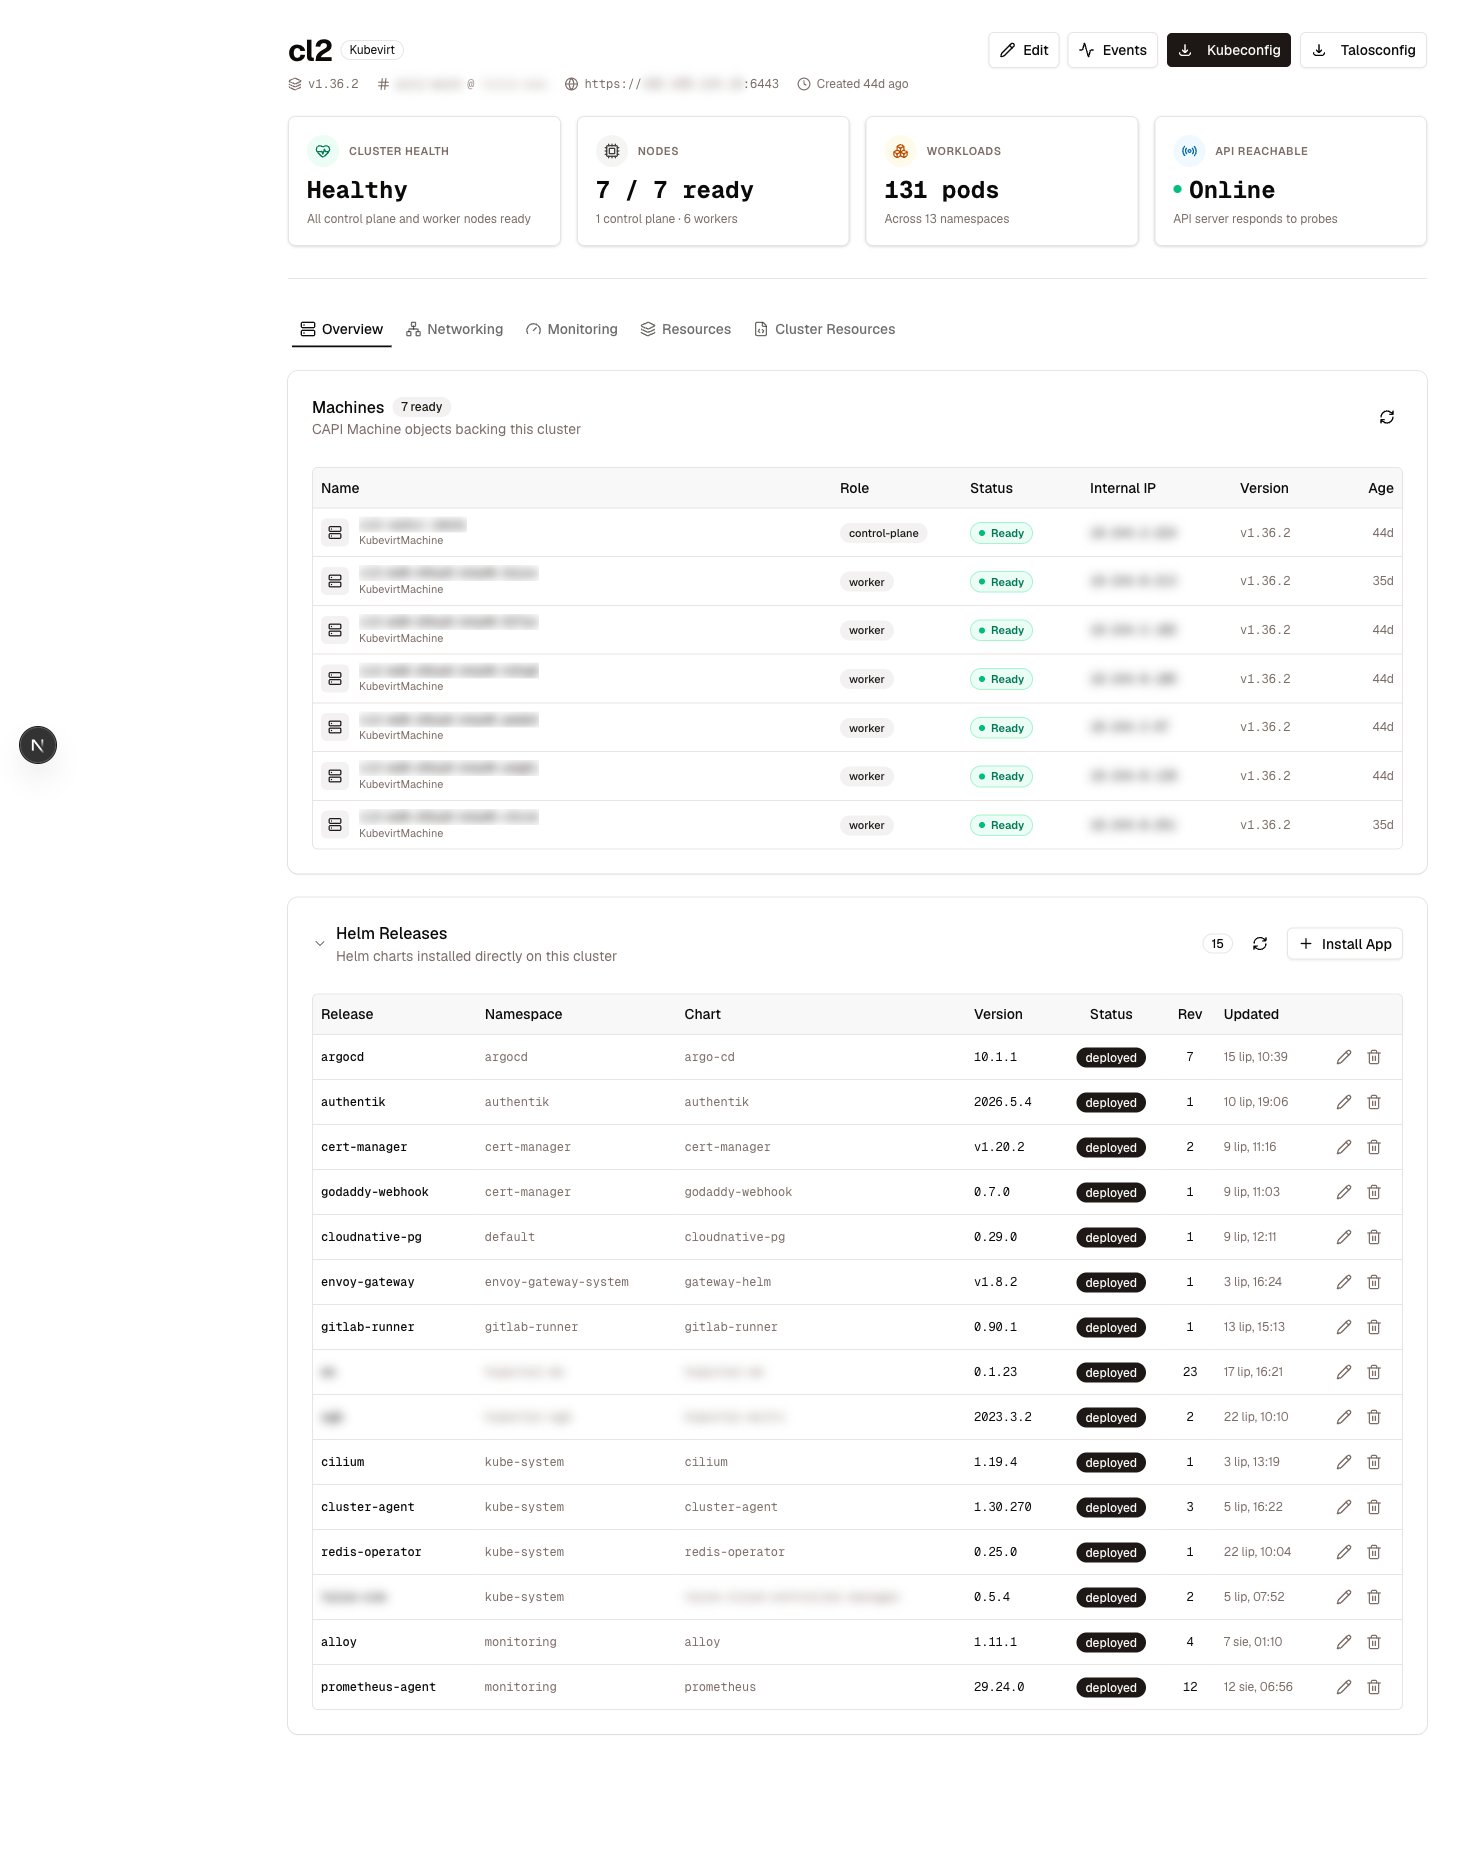
Tenants have no Flux — Celum talks Helm directly through the tenant kubeconfig.GET /api/clusters/<cluster>/helm-releases is the app inventory:
Upgrades run asynchronously — the
PUT returns a job ID and the status endpoint reports progress until the Helm operation completes.
Exposure — LoadBalancers and ingresses
Two endpoints answer “how is this cluster reachable from outside”.GET /api/clusters/<cluster>/lb-services lists its LoadBalancer Services with the external IPs the supervisor’s pools assigned:
GET /api/clusters/<cluster>/ingresses lists the HTTP surface — Ingress objects with hosts and TLS state:
/api/clusters/<cluster>/gateway/... installs Envoy Gateway inside the guest and manages its gateways and routes. Publishing through the supervisor’s shared gateway instead is covered in Gateways & routes.
Workloads — namespaces, pods, logs
The workloads drill-down goes namespace → pod list → pod detail, all inside the tenant:
The pod list is where trouble shows first — status, readiness, and restart counts per pod:
container and tailLines parameters, defaulting to the first container and the trailing 200 lines.
The kubectl-get escape hatch
When the curated views don’t cover a resource,GET /api/clusters/<cluster>/kubectl-get is a generic, read-only kubectl get against the tenant: any kind — core resources or CRDs — listed or fetched as full YAML with resourceName, scoped with resourceNamespace or allNamespaces=true. It never mutates, and Secret values are redacted. Everything it serves is subject to the same permission (cluster:GetResources) and lands in the audit log like every other call.
Permissions
Celum AI works these same views —
get_cluster_events, list_cluster_workload_pods, and get_cluster_pod_logs let it answer “why is this pod crashing?” from the identical data, and get_cluster_exposure covers the LB/ingress side.Related
Troubleshooting
The triage order that strings these reads together.
Access & credentials
Kubeconfig, talosconfig, and SSH — when you do need direct access.