
The status model
Components are installed as Flux HelmReleases. Each component’s status endpoint returns ahelmRelease block read straight from the release object on the supervisor:
A healthy monitoring stack looks like this:
reason and message are the diagnostic. When a release is not ready, the same block carries the chart controller’s explanation — a failed hook, a values error, an unreachable chart repository — verbatim. Every install panel in the UI renders it, so you rarely need kubectl to find out why a component is stuck.
Install → ready lifecycle
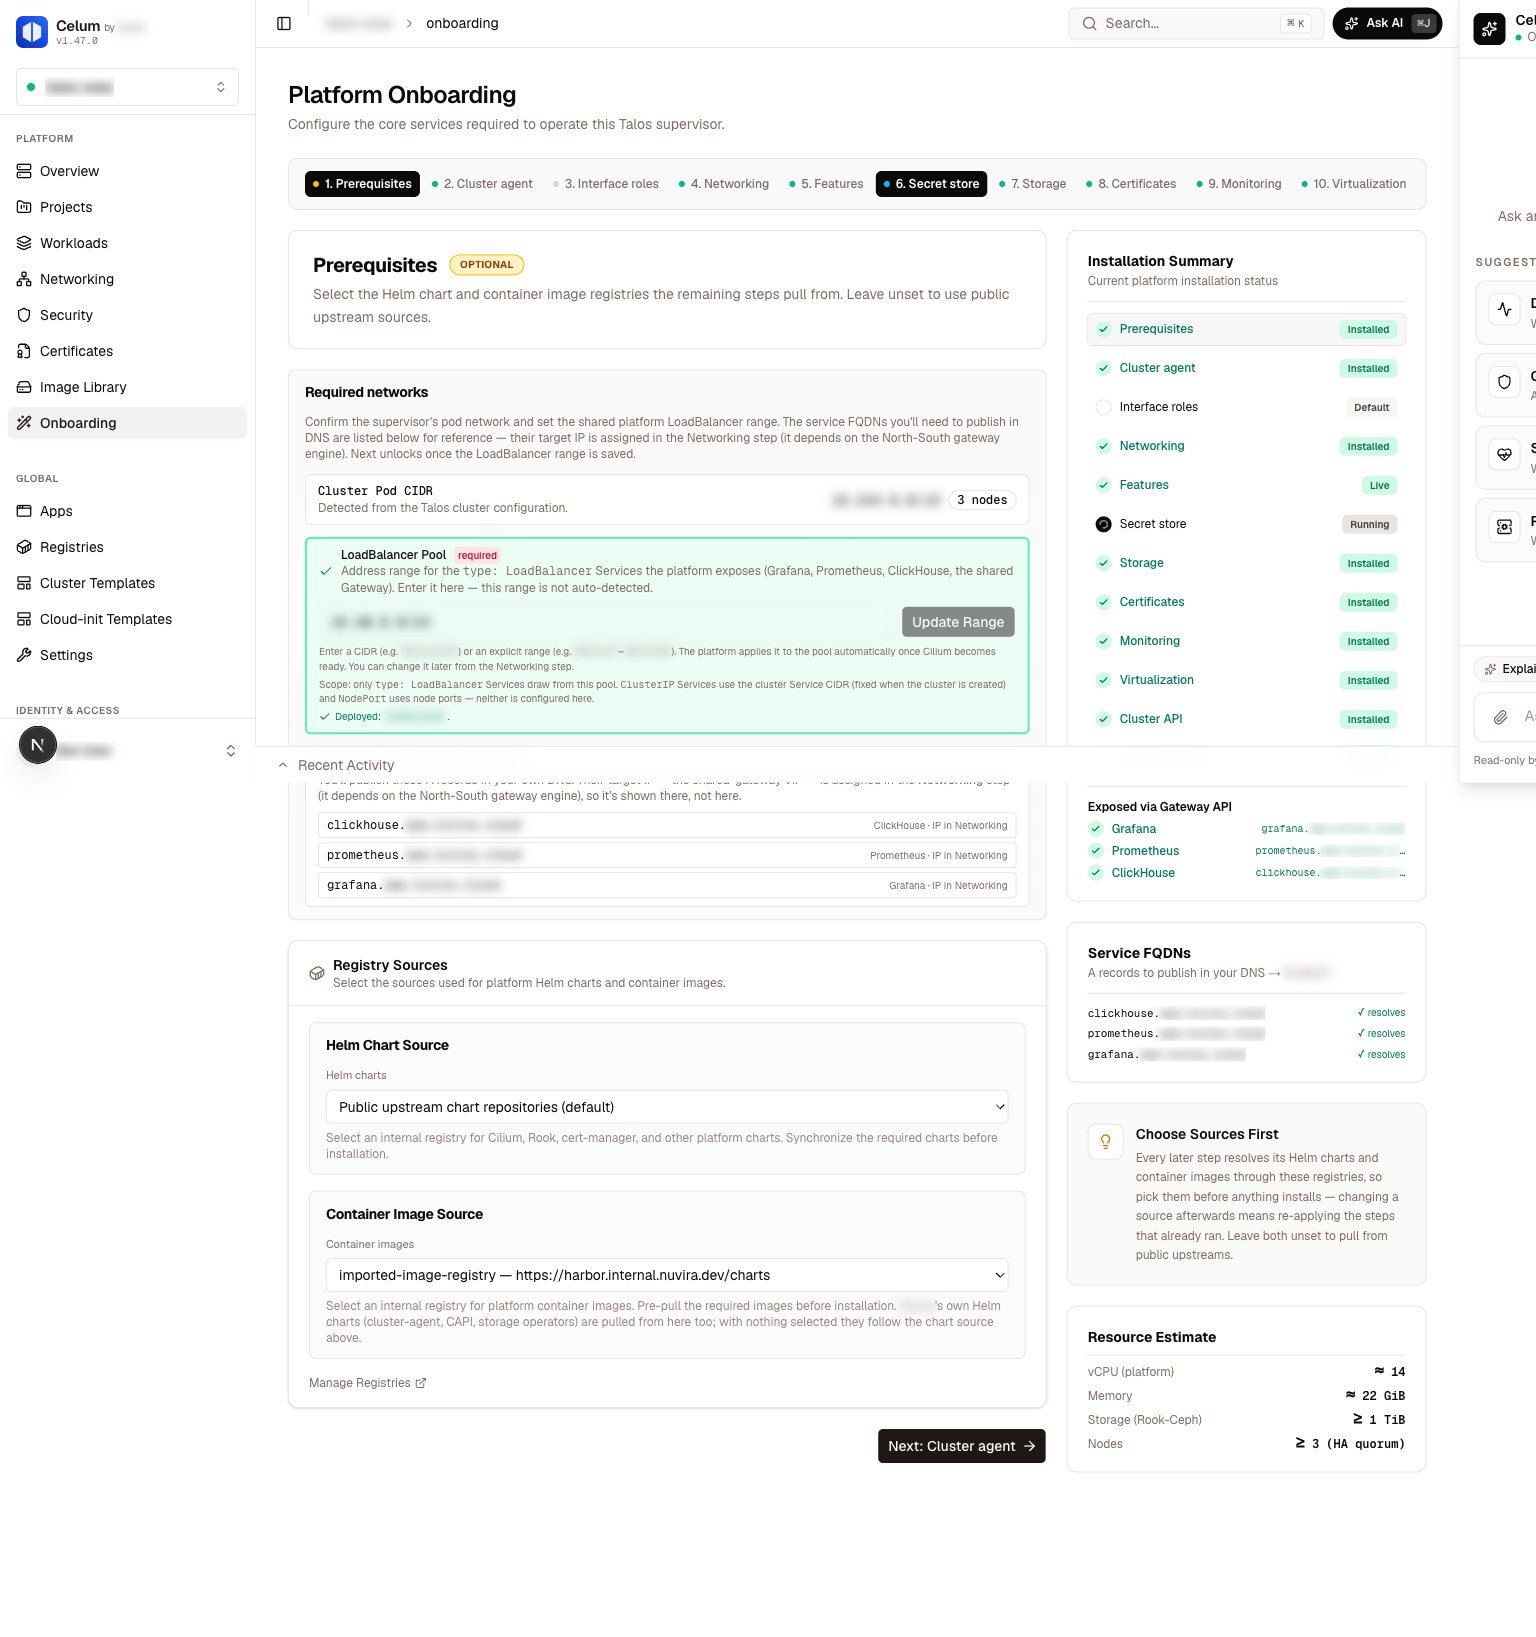
The onboarding wizard maps this lifecycle onto its step states: a step is locked until its dependencies are ready, ready when it can be installed, running while the HelmRelease exists but is not yet ready, and done once the release reportsReady. The same derivation drives the installation summary in the wizard sidebar, so the stepper reflects real cluster state on page load — not what you clicked last.
Where statuses surface
- Onboarding wizard — each install step shows the component’s chart panel: available versions with the pinned default marked, the installed version, an automatic “Upgrade to X” action when the picked version differs, a re-apply button, and the release’s
Readycondition with reason and message as the footer. - Day-2 panels — the supervisor’s Networking, Storage, Monitoring, Security, and Virtualization surfaces re-read the same status endpoints, so component state on a tab always matches what the wizard would show.
The in-product assistant, Celum AI, answers health questions from these same status APIs — asking “is monitoring healthy on this supervisor?” reads the identical data the panels render.
Release state is not the whole story
A green HelmRelease means the chart deployed. It does not mean the workloads are running, and it does not mean data is flowing. Triage in this order:1
Release state
Is the HelmRelease ready? If not, read the
Ready condition’s reason and message — this resolves most install and upgrade failures without leaving the UI.2
Version drift
Does
revision match the desired chart version? A lastAttemptedRevision ahead of revision means an upgrade is stuck — the conditions say why.3
Runtime state
Are the component’s workloads actually up? Status endpoints report runtime signals beyond the release: DaemonSet readiness for collectors, ClickHouse instance state, discovered ServiceMonitors. A release can be
Ready while a restrictive namespace policy leaves a DaemonSet at zero pods — see Logs for the classic case.4
Data freshness
For telemetry components, check that data is arriving, not just that components are green. Empty flow dashboards with every component healthy almost always means stalled ingestion — Flow telemetry makes freshness the first check.
Component families
All actions are scoped to the supervisor, e.g.
krn:vks:supervisor:<supervisor>:monitoring:* for the monitoring family and krn:vks:supervisor:<supervisor> for supervisor:GetSummary.
Networking engine health — BGP sessions, advertise drift, gateway conflicts — has its own dedicated surface; see the Networking overview.
Related
Monitoring
The Prometheus stack — install state, ServiceMonitors, and opt-in exporters.
Logs
Loki and the Alloy collectors — release state vs runtime state.
Flow telemetry
ClickHouse, the flow pipeline, and freshness — the ingestion-first triage.
Infrastructure & nodes
Node boards — capacity, disks, NICs, GPUs, and power profiles.