
GET /api/supervisors/<supervisor>/security/flows/topology?since=1h — returns the whole graph for the window: nodes for everything that talked, edges for every conversation, each edge carrying the verdict Cilium reached and whether a policy was responsible for it.
A busy supervisor produces a graph of real size. A one-hour window on a supervisor running four guest clusters returned 160 nodes and 604 edges — which is exactly why the filters below matter more than the picture.
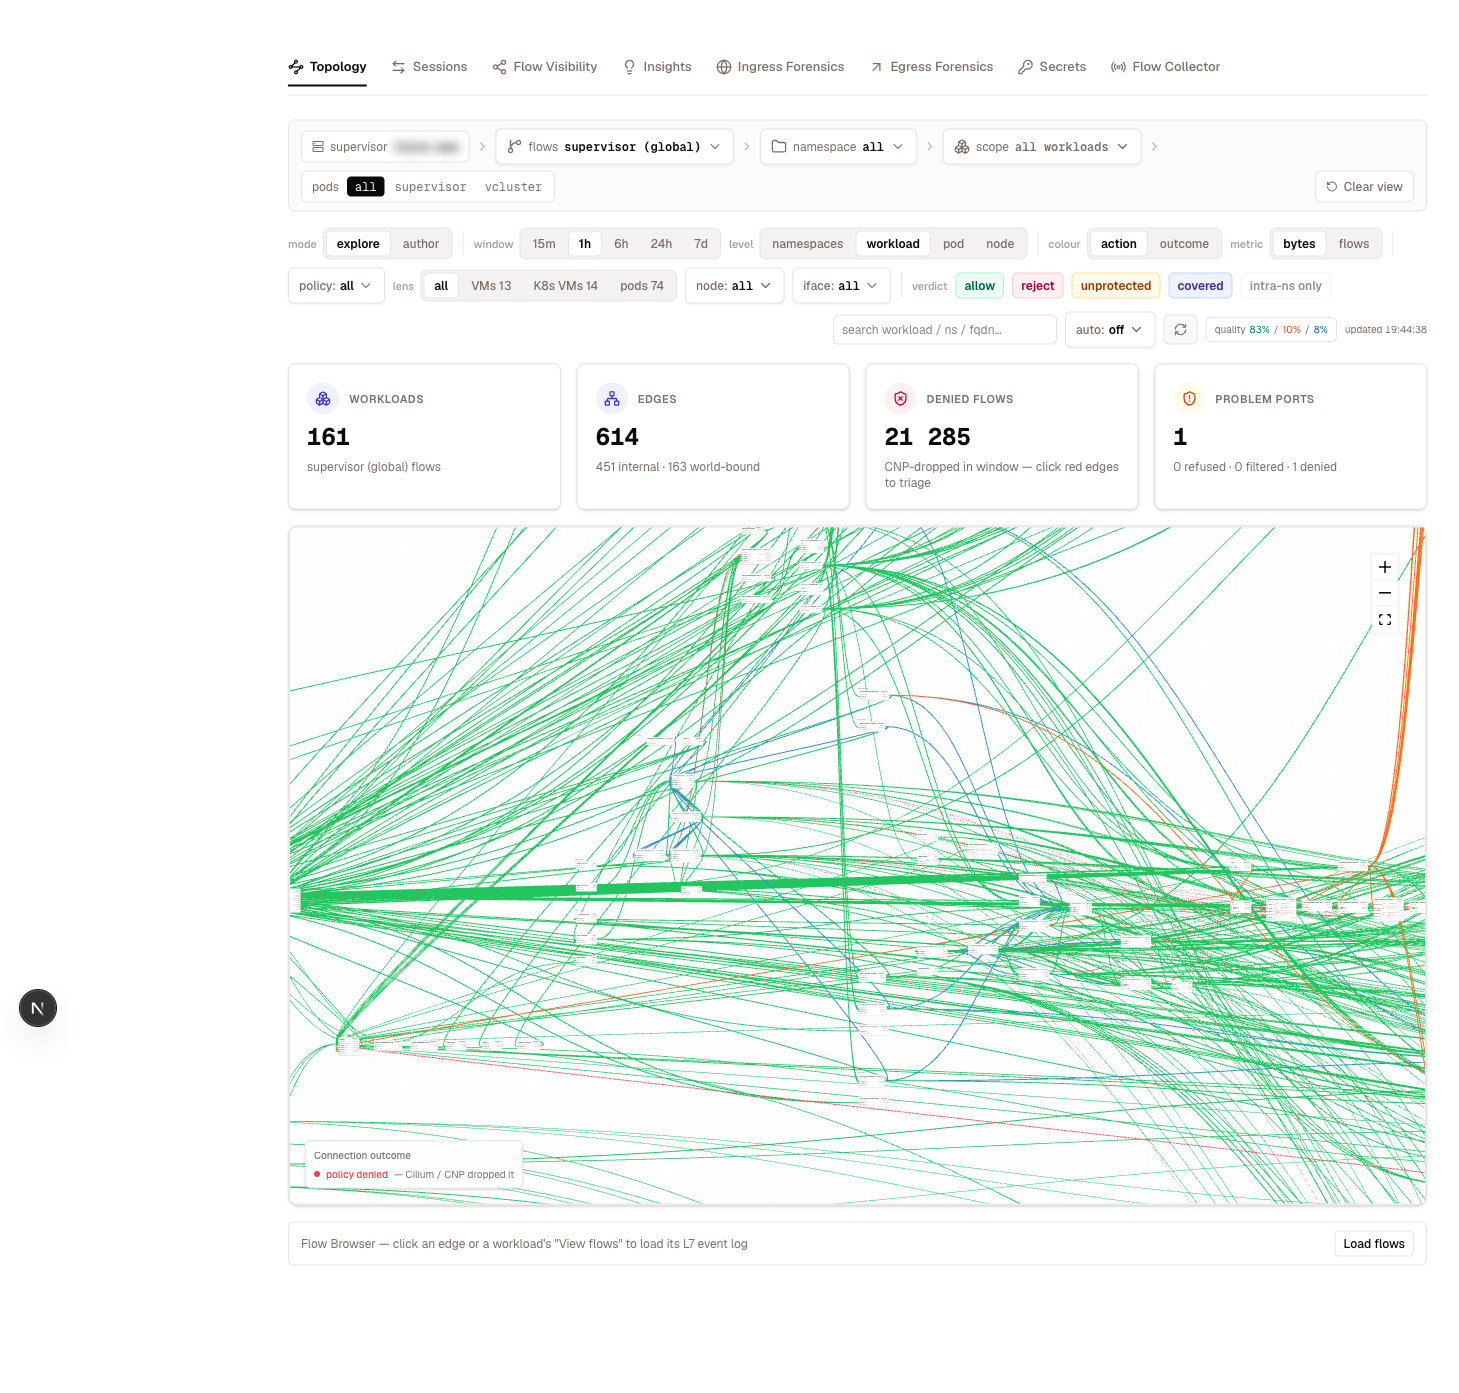
Nodes are not all pods
The graph deliberately mixes eight node kinds, because an operator asking “what does this talk to” does not care that half the answer is not a pod:
Each node carries its listening ports, which is often the most useful part of the payload — it is the observed service surface of that workload, not what a manifest claims:
peers is the discriminator worth scanning for: a port reached by one peer is a dependency, a port reached by dozens is a service. l7Protocol appears only where Cilium’s L7 layer saw the traffic.
Nodes that a policy selects also carry coveredBy:
Edges carry the verdict
Every edge is a (source, destination, port, protocol) roll-up with anaction — the single most important field on the page:
The distinction between
allow and unprotected is the point of the whole view: both mean traffic got through, but only unprotected means nothing would have stopped it. On the sample graph above, 518 edges were allow, 34 policy-protected, 30 reject, and 22 unprotected.
bytes: 0, because a connection that never established moves no payload:
outcome adds the connection-level result (established, delivered, policy-denied) where conntrack could determine it, and trafficDirection (INGRESS/EGRESS) appears on edges observed from one side only.
Narrowing the graph
The full graph is a starting point, not an answer. The controls map one-to-one onto query parameters:by=node is the fastest way to answer “is this a workload problem or a machine problem”. origin exists because a vcluster’s pods are synced onto the host as ordinary pods that can carry byte-identical labels to a native twin — see Pipeline & runtime.
Two helper endpoints back these controls: flows/dimensions enumerates the nodes and interfaces present in the window, and flows/labels returns the label keys and values actually seen, so a filter never offers a value that returns nothing.
Coverage has known blind spots
Edge coverage is computed by matching observed workloads against the workloads that applied policies select. That matching has three documented limits, and every one of them makes the graph look less protected than it is:- Only Cilium policies count. Coverage walks
CiliumNetworkPolicyandCiliumClusterwideNetworkPolicy. A standardnetworking.k8s.io/v1NetworkPolicy is enforced by Cilium perfectly well but is not counted — edges it protects render asunprotected. If you want the graph to reflect a policy, express it as a CNP (or apply both). - Shared chart labels collapse. When several tiers of one Helm chart share a single
app.kubernetes.io/name, they fold into one coverage key while the graph still shows each Deployment separately. Intra-namespace edges between those tiers can stayunprotectedalthough enforcement is correct.
From the graph to everything else
The graph is where investigations start and then leave. A node with a suspicious ingress port leads to Ingress Forensics; anexternal peer that shouldn’t be there leads to Egress Forensics; an unprotected edge you want to close leads to author mode on this same tab, which is covered in Network policies.
Celum AI reads the same graph.
get_flow_topology returns nodes and edges with all the filters above, get_policy_coverage returns which policies cover which workloads, and get_workload_identity resolves the label set a selector would have to match.