
The cluster rollup
The board opens with the cluster totals:Node rows
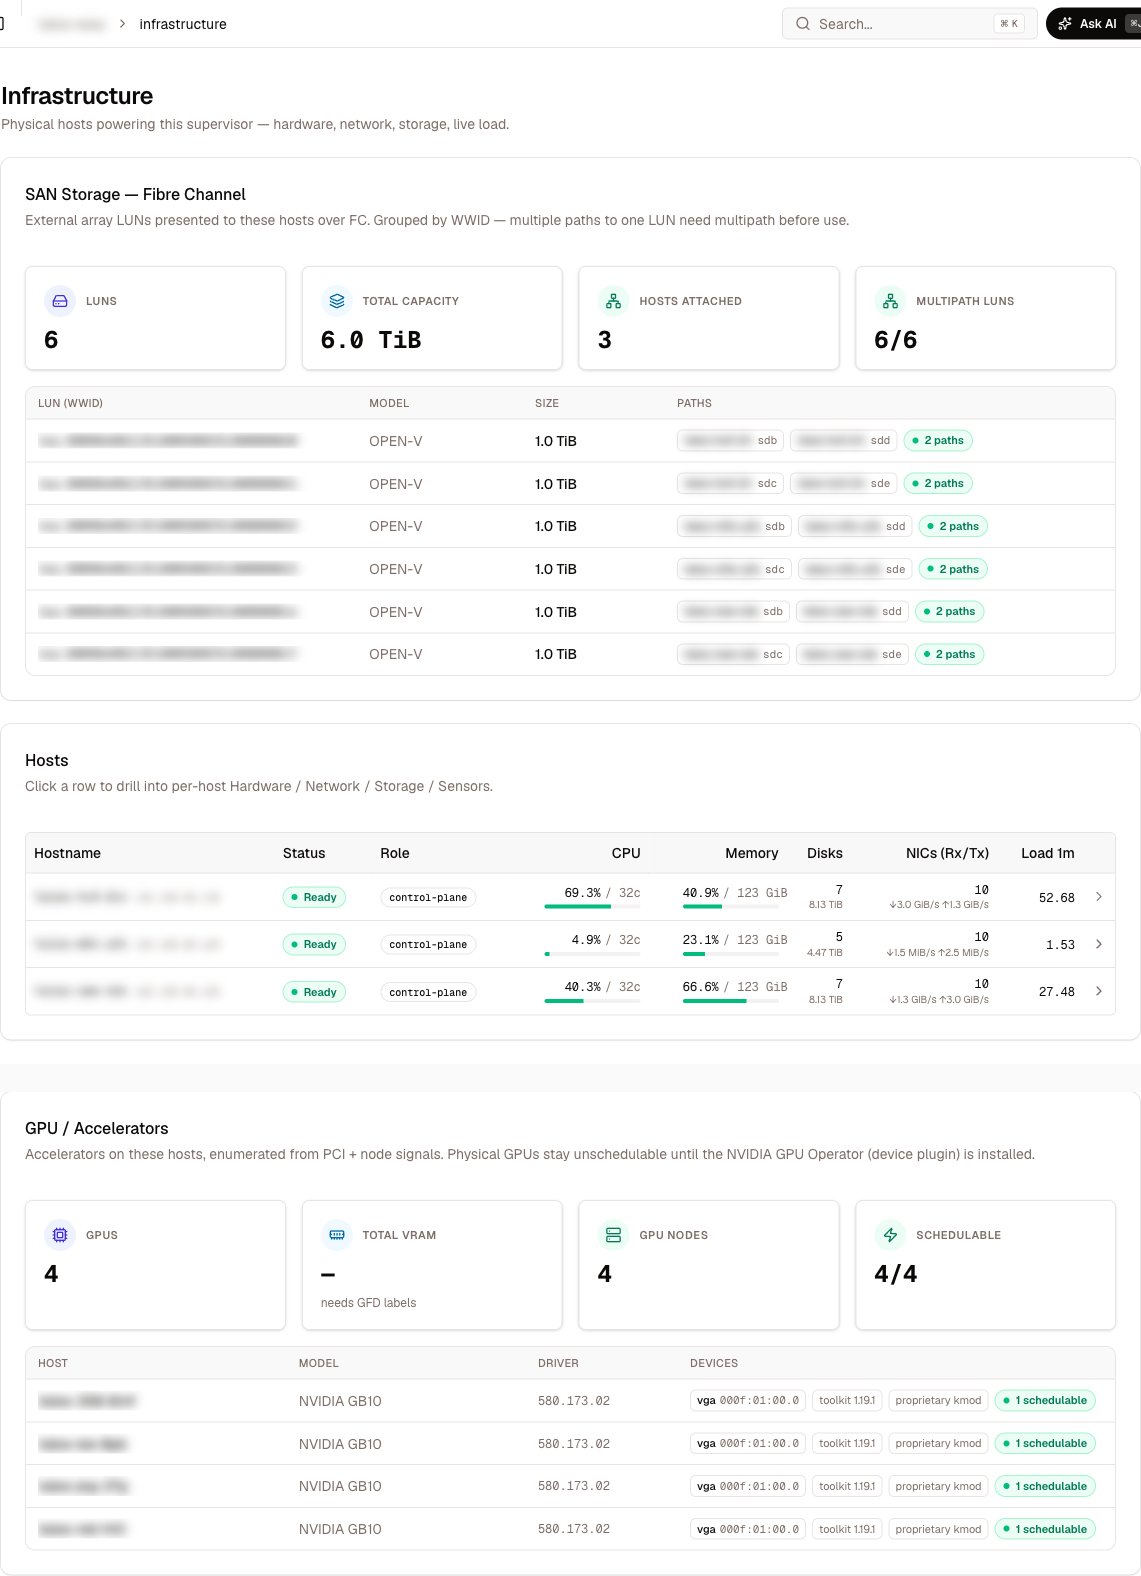
One row per node — readiness, schedulability, and live utilization side by side:
Each node also carries its identity block: internal IP, OS and kernel (e.g.
Talos (v1.12.6) / 6.18.18-talos), kubelet version, container runtime, architecture, and uptime. A node that is not ready or cordoned (unschedulable) is flagged on its row — those two signals are the board’s node-condition summary.
Version skew is easiest to catch here: kubelet, OS, and kernel versions sit next to each other for every node, so one node lagging after a rolling upgrade stands out immediately.
Per-node detail
Expanding a node (or opening its detail view) shows the full hardware inventory.Disks
Every block device with model, size, transport, and a system disk marker:
The transport field distinguishes local NVMe from Fibre Channel LUNs and removable media — useful when picking devices for storage clusters, since the system disk and removable devices must stay out.
NICs
Per-interface state with live traffic rates: name, MTU, VLAN tag for subinterfaces, addresses, link state, and current receive/transmit throughput. A typical bare-metal node shows a high-MTU bond (e.g.bond0, MTU 9000) with VLAN subinterfaces carrying the management, storage, and workload networks — the rates make it obvious which VLAN the traffic actually rides.
Fibre Channel
Nodes with FC HBAs list each port: WWPN, port state (Online), speed (e.g. 16 Gbit), and port type. Two online ports per node is the healthy dual-path picture; a port stuck offline explains multipath degradation before you go looking at the SAN.
GPUs
GPU inventory is discovered from the PCI bus by the cluster agent, so accelerators show up even before any driver or exporter is installed. For utilization metrics on top of inventory, install the NVIDIA DCGM exporter.Power profiles
Bare-metal supervisors expose a cluster-wide CPU power profile:eco, balanced, or performance.
- The control appears only when the supervisor is tunable: the nodes are bare metal (detected from the node provider ID) and the power-tuning agent is deployed. VM-based supervisors hide the card — their CPU policy belongs to the hypervisor.
- The status lists each node with its detected platform, so a mixed cluster shows exactly which nodes the profile can affect.
- Setting a profile updates a single cluster-wide setting; the agent reconciles every node within about 30 seconds.
Namespaces and the resource browser
Two adjacent supervisor views round out the picture:- Namespaces — the flat list of namespaces on the supervisor, the quickest way to see which platform components and projects are present.
- Resource browser — live workloads with status, readiness, age, restart count, pod IP, and the node each pod runs on. Restart counts here are the bridge between the hardware board and workload health: a node with elevated restarts across many pods is a node problem, not an application problem.
Permissions
Related
Platform health overview
The component-status model that complements the hardware view.
Monitoring
The exporters that turn this inventory into time series.
Supervisors & clusters
What a supervisor is and how nodes relate to tenant clusters.
Networking overview
The network fabric behind the NICs and VLANs on this page.