
What this changes on your cluster
Nothing. Every operation on this page is a read. It is the first station in this sequence where that is true, and worth saying plainly: you can explore all of it on a production supervisor without consequence.Before you start
- The Flow Telemetry step, from onboarding. Without it every view on this page is empty, correctly and unhelpfully.
- Permission
security:Read, scopedsupervisor:<name>:security:*.
The shape of it
Check the pipeline is alive → read the graph → judge whether to trust it → know what it cannot see. Doing these in a different order is how people conclude the product is wrong when the ingestion simply stopped.Step 1 — Freshness, before anything else
An empty graph has two completely different causes and they look identical.- Dashboard
- API
- MCP
The Security page reports the window it queried and how fresh the data behind it is.
Step 2 — Read the graph
- Dashboard
- API
- MCP
Security → Topology, then pick a namespace. The supervisor-wide read is the slowest view, so it does not run until you choose all namespaces yourself.
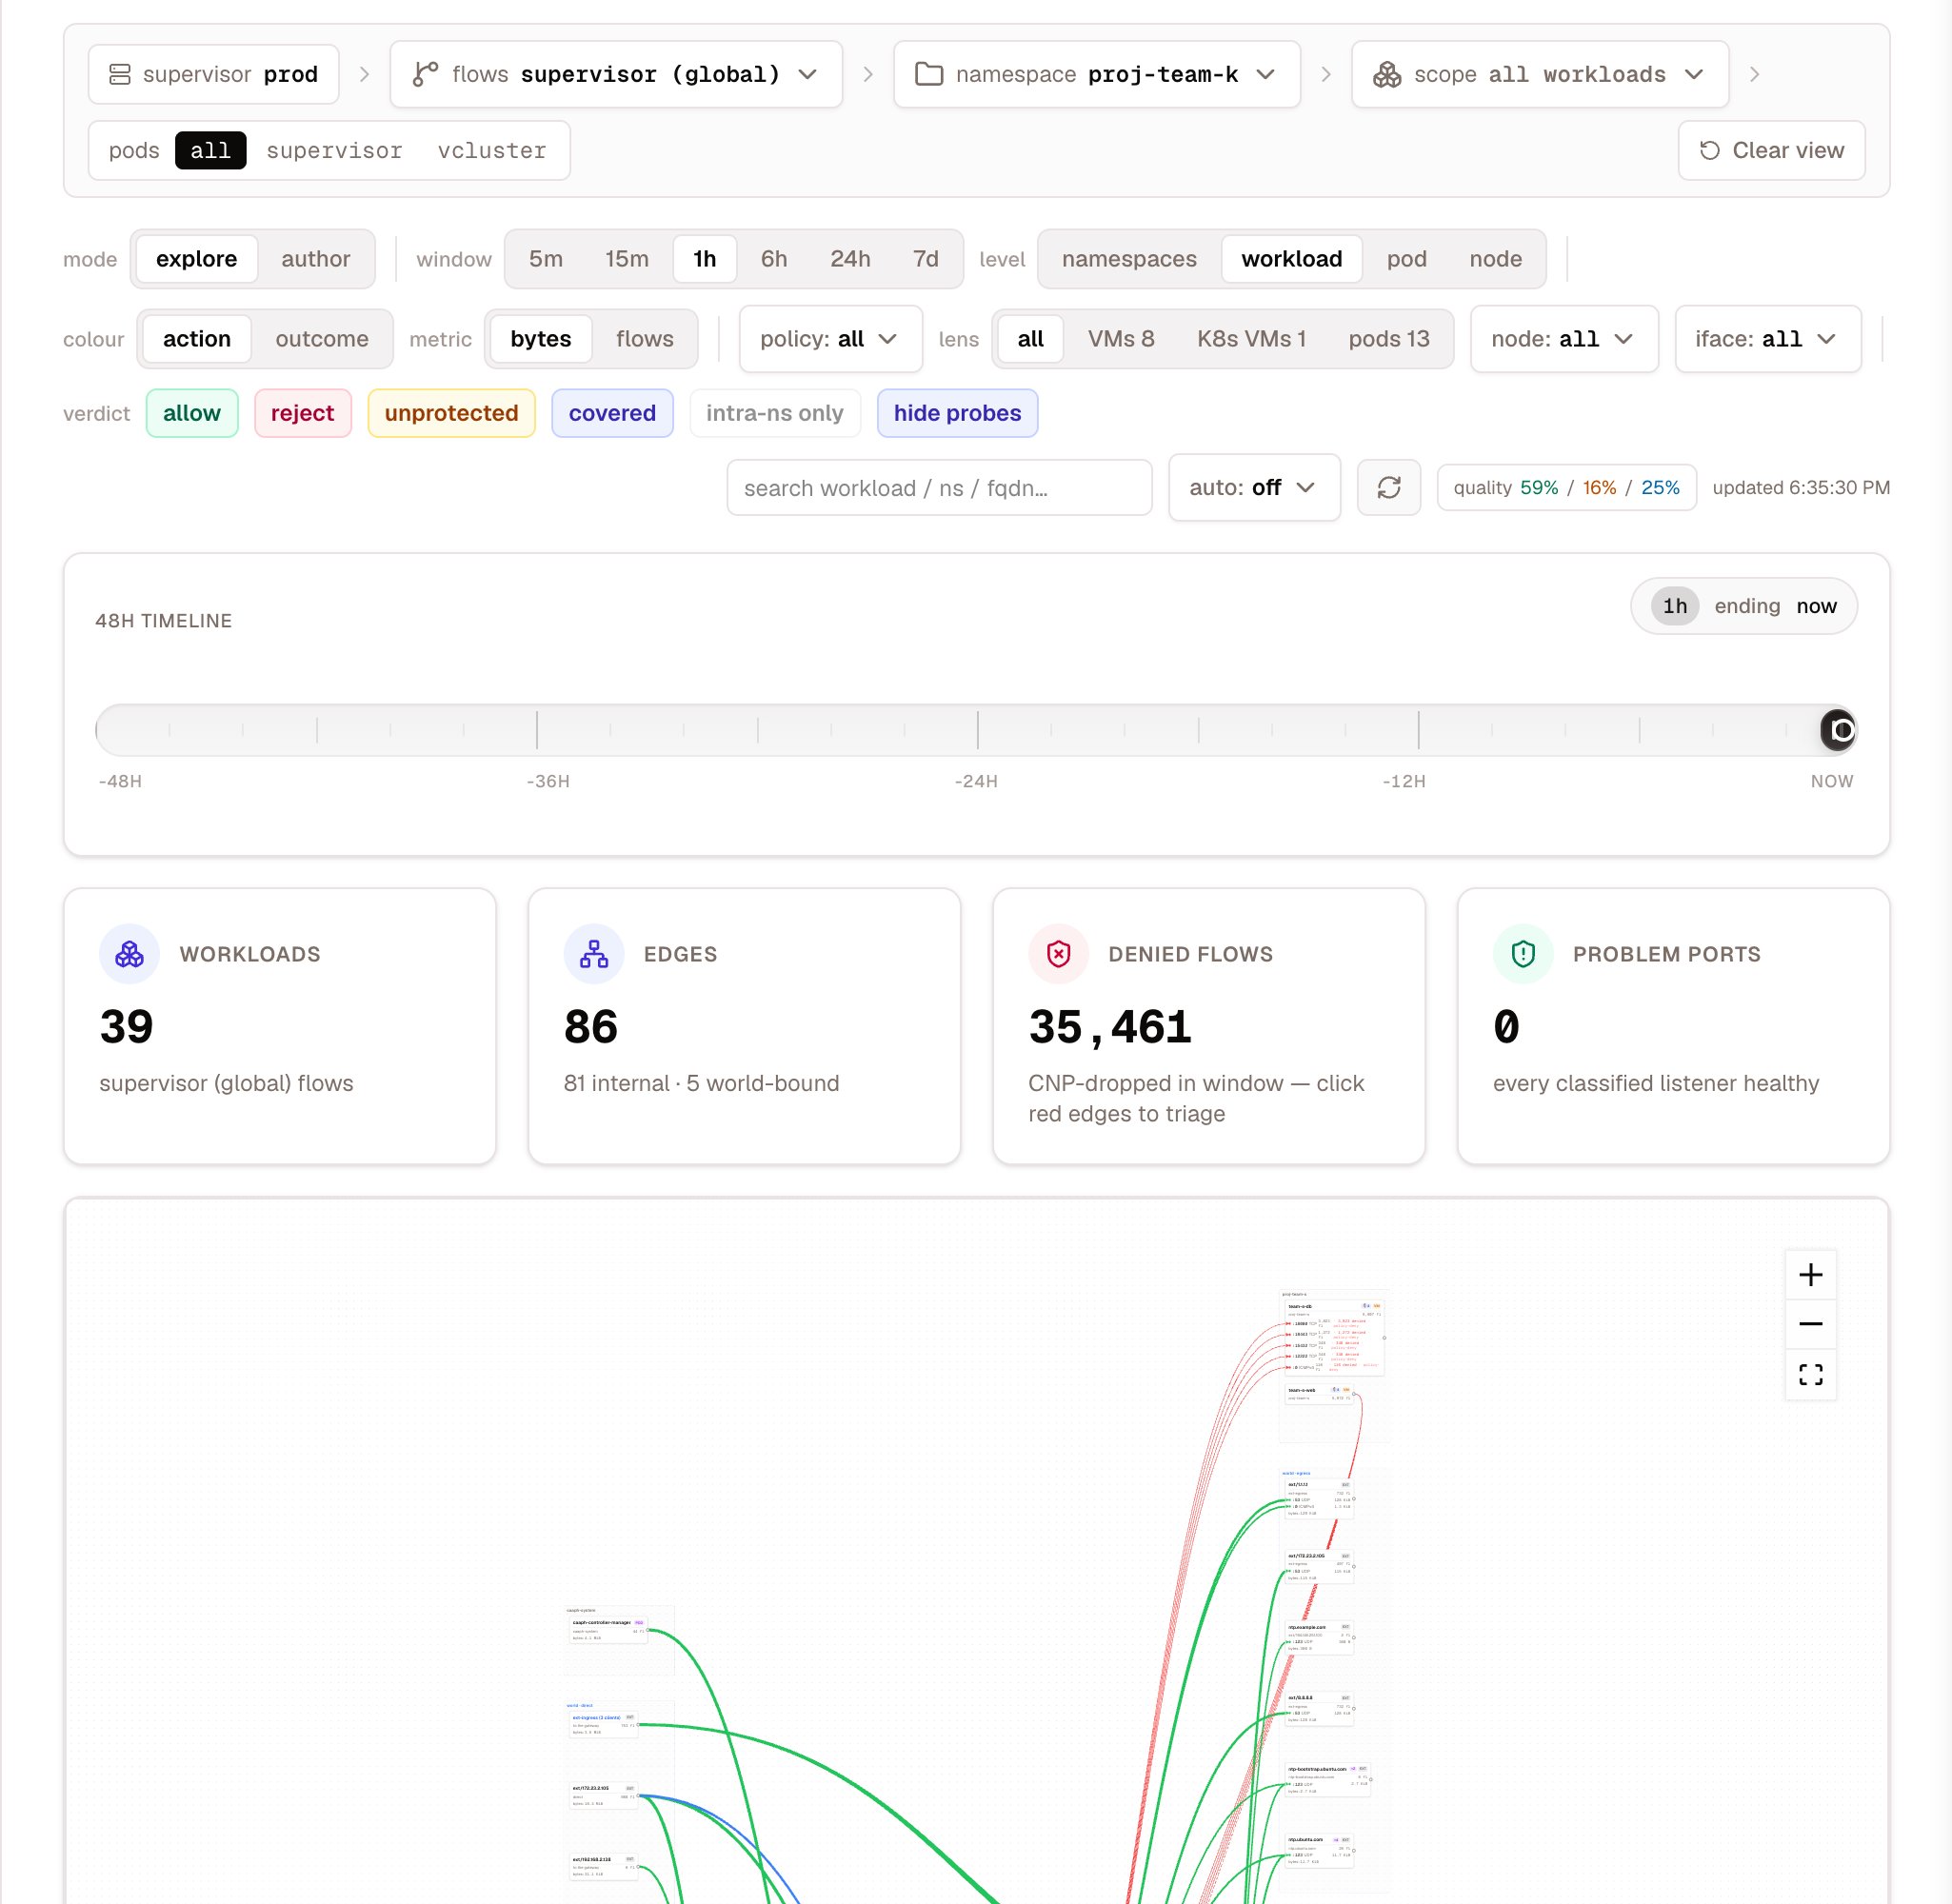
Topology for one namespace: the filters, the window, the counts, and the graph below them
origin, node and interface narrow further. origin is the one that matters on a shared namespace: it separates a supervisor’s own workload from a vcluster’s when both carry byte-identical labels.
Result: nodes and edges, each edge with a verdict and whether a policy covers it.
Step 3 — Decide whether to believe it
A graph that renders is not automatically a graph that is right. Two checks tell you how much weight it will bear. Edge quality.get_flow_analytics with view=edge-quality reports how many edges actually carry flow and byte data. Edges without either are inferences, not observations.
Destination resolution. An edge whose destination does not resolve to a workload is, in the words of Celum’s own parity test, “an edge to nowhere” — and not an edge. That test exists because a correlator fault produced a graph that looked populated and resolved 0% of its destinations, while healthy clusters resolved nearly all of theirs. A low resolution rate is the single clearest sign the graph is lying to you.
Count agreement is not agreement. An edge is the triple (source, destination, port), and two clusters can each report twenty edges and share none of them. Whenever you compare two views — two clusters, two windows — compare the sets, never the totals.
What the graph cannot see
Three blind spots, all structural. None of them is a fault you can fix by waiting, and each makes something look unprotected that is in fact protected. Workloads without a recognised name label are invisible to policy coverage. The identity index keys on exactly four labels, in order:class=frontend, say — is not indexed, so no policy coverage propagates to it however well it is protected. If you want a workload to show as covered, give it an app label alongside whatever else you use.
Standard Kubernetes NetworkPolicies do not count toward coverage. The coverage map walks CiliumNetworkPolicy and CiliumClusterwideNetworkPolicy only. Cilium enforces a plain networking.k8s.io/v1 NetworkPolicy perfectly well — the traffic really is dropped — but the edge still paints as unprotected, because nothing looked for that kind.
Charts that share one app.kubernetes.io/name across tiers collapse to a single key. Coverage then keys on the shared name while the edges carry each tier’s real workload name, the lookup misses, and intra-namespace edges between tiers stay unprotected on screen while being enforced in reality.
What it can see that you might not expect
Denied traffic. A blocked connection produces neither conntrack bytes nor a policy reference, so the ordinary pipeline emits no row for it at all — which would make the first drop invisible exactly when you most want to see it, before any policy exists to explain it. Celum reads those from the raw flow table and grafts them on as synthetic reject edges, attached to the same graph node as that workload’s other traffic rather than spawning a phantom beside it.What commonly goes wrong
Next
Topology
Node kinds, verdicts, grouping and filters in full.
Flow analytics
The aggregate views — namespace chords, FQDN egress, L7 and DNS breakdowns.
Network policies
Turning what you just observed into a policy, dry-run first.
Flow telemetry
The pipeline behind all of it, and why freshness is always the first check.